![]()
Aircraft Carriers, Small (CVL)
Index
As of 1 December 1944
Name No. Class Page Name No. Class Page Bataan CVL 29 CVL 22 Class 177 Independence CVL 22 CVL 22 Class 177 Belleau Wood CVL 24 CVL 22 Class 177 Langley CVL 27 CVL 22 Class 177 Cabot CVL 28 CVL 22 Class 177 Monterey CVL 26 CVL 22 Class 177 Cowpens CVL 25 CVL 22 Class 177 San Jacinto CVL 30 CVL 22 Class 177
[B L A N K]
DATA PERIOD 1944-1945 CVL 22
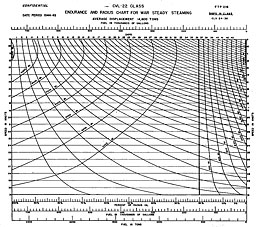
ENDURANCE AND RADIUS CHART FOR WAR STEADY STEAMING
MEAN DISPLACEMENT: 14,800 TONS
Fuel in Thousands of GallonsSHIPS IN CLASS:
CVL 24-30
* See table V.
DATA PERIOD 1944-1945 CVL 22 CLASS
Table I.--WAR LOGISTICS DATA FOR STEADY STEAMING
BASED ON RADIUS OIL*SHIPS IN CLASS:
CVL 24-30
PROPELLER SPEED FUEL RATE ENDURANCE SPEED RADIUS SPEED RADIUS FUEL RATE WORK COLUMN MEAN NORMAL RANGE DAILY Mean displacement 14,800 tons† Mean displacement 12,800 tons Mean displacement 14,800 tons† (1) (2) (3) (4) (5) (6) (7) (8) (9) (10) (11) R.P.M. Gal./hr. Gal./hr. Bbl./day Hours Days Knots Engine miles Knots Engine miles Gal./eng. mi. 100 723 639-814 413±19 1,036±10 43.2 9.8±0.1 10,850±220 9.7±0.1 10,050±210 74.5 110 806 712-908 461±21 930±10 38.8 11.0±.1 11,030±220 10.9±.1 10,140±210 73.9 120 898 793-1,011 513±23 834±9 34.8 12.1±.1 10,900±210 12.0±.1 10,010±200 74.8 130 1,002 885-1,128 573±26 748±9 31.2 13.2±.1 10,890±210 13.1±.1 9,800±200 76.5 140 1,117 987-1,258 638±29 671±8 28.0 14.2±.1 10,620±210 14.0±.1 9,390±190 79.8 150 1,246 1,101-1,403 712±32 601±8 25.0 15.2±.1 10,200±200 15.0±.1 9,020±190 83.1 160 1,389 1,227-1,564 794±36 539±7 22.5 16.1±.1 9,790±200 15.9±.1 8,570±170 87.4 170 1,549 1,368-1,744 885±40 484±7 20.2 17.1±.1 9,420±200 16.9±.1 8,180±170 91.7 180 1,727 1,525-1,945 987±45 434±7 18.1 17.9±.1 8,950±200 17.7±.1 7,680±170 97.6 190 1,927 1,702-2,170 1,101±50 389±6 16.2 18.8±.1 8,520±200 18.6±.1 7,240±170 103.6 200 2,149 1,898-2,420 1,228±56 349±6 14.5 19.8±.1 8,140±200 19.6±.1 6,840±170 109.6 210 2,396 2,116-2,698 1,369±62 313±6 13.0 20.7±.1 7,620±200 20.5±.1 6,420±170 116.9 220 2,673 2,361-3,010 1,527±69 280±5 11.7 21.7±.1 7,160±200 21.4±.2 5,990±170 124.9 230 2,981 2,633-3,357 1,703±77 251±5 10.5 22.7±.2 6,790±200 22.3±.2 5,600±170 133.7 240 3,325 2,937-3,744 1,900±86 225±5 9.4 23.7±.2 6,350±200 23.3±.2 5,240±170 142.7 250 3,709 3,276-4,176 2,119±96 202±5 8.4 24.7±.2 5,950±200 24.3±.2 4,910±170 152.6 260 4,138 3,655-4,659 2,365±107 181±4 7.5 25.9±.3 5,650±200 25.4±.3 4,600±160 162.9 270 4,615 4,076-5,197 2,637±119 162±4 6.8 27.0±.3 5,260±200 26.5±.3 4,290±160 174.2 280 5,149 4,548-5,798 2,942±133 146±4 6.1 28.0±.3 4,900±170 27.5±.3 4,020±160 187.2 290 5,744 5,073-6,468 3,282±148 130±4 5.4 28.7±.3 4,450±170 28.2±.3 3,670±160 203.7 300 6,408 5,660-7,216 3,662±166 117±4 4.9 29.4±.3 4,060±170 28.9±.3 3,380±160 221.7 310 7,149 6,314-8,050 4,085±185 105±4 4.4 30.0±.3 3,720±160 29.5±.3 3,100±160 242.3 320 7,976 7,045-8,981 4,558±206 94±3 3.9 30.6±.3 3,370±160 30.0±.3 2,820±130 265.9 330 8,898 7,859-10,019 5,085±230 84±3 3.5 31.1±.4 3,020±140 30.5±.3 2,560±130 291.7 336 9,502 8,393-10,699 5,430±245 79±3 3.3 31.4±.4 2,830±140 ‡30.7±.4 2,430±130 309.5
† Mean displacement during DATA PERIOD.
‡ Estimated speed at designed shaft horsepower (100,000 s.h.p.)
DATA PERIOD 1944-1945
CVL 22 CLASSSHIPS IN CLASS:
CVL 24-30
Table II.--WAR LOGISTICS DATA: UNDERWAY AVERAGES
* Based on radius oil; see table V.
Average speed Fuel rate Endurance* R.P.M. Knots Bbl./day Days 182.4 17.9 1,134±268 15.7±1.3
Table III.--WAR LOGISTICS DATA: NOT UNDERWAY
*Based on radius oil; see table V.
Fuel rate Endurance* Gal./hr. Bbl./day Days 212 121 147.3
Table IV.--PROPELLER SPECIFICATIONS
Note.--All under-way data are based on the propellers specified below.
In the case of ships whose propellers do not conform to these specifications,
see discussion of table IV in Introduction.In case of a propeller change see discussion of table IV in Introduction.
Number of propellers Number of blades Diameter Pitch 2 Inboard 4 11'10" 11'8" 2 Outboard 4 11'10" 12'1"
Table V.--FUEL CAPACITIES
Capacity Gallons Barrels Tons "Full load" fuel oil capacity§ 722,970 17,214 2,610 Diesel oil capacity (95%) 26,376 628 84 Total: radius oil* 749,346 17,842 2,694 Additional fuel oil required to fill all tanks to 95% (emergency) 0 0 0 Total: maximum capacity (95%)* 749,346 17,842 2,694
§ Based on considerations of cruising radius and power of survival as affected by reserve buoyancy.
* For this class of vessel radius oil and maximum capacity (95%) are identical.Conversion factors:
Diesel oil: 314 gallons = 1 ton. Fuel oil: 277 gallons = 1 ton. Diesel oil and fuel oil: 42 gallons = 1 barrel.
Table IAA.--WAR LOGISTICS DATA FOR STEADY STEAMING BASED ON MAXIMUM CAPACITY (95%)*
Note.--Fueling beyond the radius oil capacity increases radius at the expense of resistance
to underwater damage. This table is made available to the commander as a supplement to table I
for use when increased radius and decreased resistance to underwater damage are factors in a decision.
* See table V.
Speed Radius Endurance Fuel rate Mean displacement, 14,800 tons Knots Engine miles Days Bbl./day 10 10,070 42.1 425 11 10,130 38.4 466 12 10,010 34.8 513 13 9,820 31.5 568 14 9,390 28.0 638 15 9,020 25.0 712 16 8,530 22.3 803 17 8,120 19.9 898 18 7,530 17.5 1,025 19 7,080 15.5 1,152 20 6,650 13.8 1,291 21 6,180 12.3 1,457 22 5,730 10.9 1,644 23 5,350 9.7 1,841 24 5,010 8.7 2,053 25 4,710 7.8 2,276 26 4,430 7.1 2,513 27 4,160 6.4 2,790 28 3,770 5.6 3,185 29 3,330 4.8 3,732 30 2,820 3.9 4,558
Table VI.--STEADY STEAMING MEAN FUEL RATE RATIOS*
* Table VI is used to adjust the class data in tables I and IAA to individual ships.
Ship Average displacement Fuel rate ratio--ship: Class 100 R.P.M. 150 R.P.M. 200 R.P.M. 250 R.P.M. 300 R.P.M. Tons Percent Percent Percent Percent Percent U.S.S. Belleau Wood CVL 24 14,400 97.1 97.5 97.9 98.1 98.3 U.S.S. Cowpens CVL 25 14,800 98.3 100.4 102.5 104.6 106.6 U.S.S. Monterey CVL 26 14,500 103.6 105.5 107.3 109.1 110.8 U.S.S. Langley CVL 27 14,600 106.4 102.0 97.8 93.6 89.5 U.S.S. Cabot CVL 28 15,200 101.5 102.1 102.5 102.9 103.3 U.S.S. Bataan CVL 29 14,900 89.0 92.1 95.3 98.5 101.7 U.S.S. San Jacinto CVL 30 15,200 104.1 100.4 96.8 93.2 89.7
The ratios were obtained by dividing the steady steaming mean fuel rates of the indicated ships
by the corresponding mean fuel rates given in column (2) of table I.
[B L A N K]
Table of Contents
Previous Chapter (Aircraft Carriers) * Next Chapter (Aircraft Carriers, Escort)