![]()
Aircraft Carriers, Escort (CVE)
Index
As of 1 December 1944
Name No. Class Page Admiralty Islands CVE 99 CVE 55 Class 199 Altamaha CVE 18 CVE 9 Class 187 Anzio CVE 57 CVE 55 Class 199 Attu CVE 102 CVE 55 Class 199 Badoeng Strait CVE 116 CVE 105 Class 203 Bairoko CVE 115 CVE 105 Class 203 Barnes CVE 20 CVE 9 Class 187 Bismarck Sea CVE 95 CVE 55 Class 199 Block Island CVE 106 CVE 105 Class 203 Bogue CVE 9 CVE 9 Class 187 Bougainville CVE 100 CVE 55 Class 199 Breton CVE 23 CVE 9 Class 187 Cape Esperance CVE 88 CVE 55 Class 199 Cape Gloucester CVE 109 CVE 105 Class 203 Card CVE 11 CVE 9 Class 187 Casablanca CVE 55 CVE 55 Class 199 Charger CVE 30 CVE 30 195 Chenango CVE 28 CVE 26 Class 191 Commencement Bay. CVE 105 CVE 105 Class 203 Copahee CVE 12 CVE 9 Class 187 Core. CVE 13 CVE 9 Class 187 Corregidor CVE 58 CVE 55 Class 199 Croatan CVE 25 CVE 9 Class 187 Fanshaw Bay CVE 70 CVE 55 Class 199 Gilbert Islands CVE 107 CVE 105 Class 203 Guadalcanal CVE 60 CVE 55 Class 199 Hoggatt Bay CVE 75 CVE 56 Class 199 Hollandia CVE 97 CVE 56 Class 199 Kadashan Bay CVE 76 CVE 55 Class 199 Kalinin Bay CVE 68 CVE 55 Class 199 Kasaan Bay CVE 69 CVE 55 Class 199 Kitkun Bay CVE 71 CVE 55 Class 199 Kula Gulf CVE 108 CVE 105 Class 203 Kwajalein CVE 98 CVE 55 Class 199 Long Island CVE 1 CVE 1 183 Lunga Point CVE 94 CVE 55 Class 199 Makassar Strait CVE 91 CVE 55 Class 199 Makin Island CVE 93 CVE 55 Class 199 Manila Bay CVE 61 CVE 55 Class 199 Marcus Island. CVE 77 CVE 55 Class 199 Matanikau CVE 101 CVE 55 Class 199 Mission Bay CVE 59 CVE 55 Class 199 Munda CVE 104 CVE 55 Class 199 Nassau CVE 16 CVE 9 Class 187 Natoma Bay CVE 62 CVE 55 Class 199 Nehenta Bay CVE 74 CVE 55 Class 199 Ommaney Bay CVE 79 CVE 55 Class 199 Petrof Bay CVE 80 CVE 55 Class 199 Point Cruz CVE 119 CVE 105 Class 203 Prince William CVE 31 CVE 9 Class 187 Puget Sound CVE 113 CVE 105 Class 203 Rendova CVE 114 CVE 105 Class 203 Roi CVE 103 CVE 55 Class 199 Rudyerd Bay CVE 81 CVE 55 Class 199 Saginaw Bay CVE 82 CVE 55 Class 199 Saidor CVE 117 CVE 105 Class 203 Salamaua CVE 96 CVE 55 Class 199 Salerno Bay CVE 110 CVE 105 Class 203 Sangamon CVE 26 CVE 26 Class 191 Santee CVE 29 CVE 26 Class 191 Sargent Bay CVE 83 CVE 55 Class 199 Savo Island CVE 78 CVE 55 Class 199 Shamrock Bay CVE 84 CVE 55 Class 199 Shipley Bay CVE 86 CVE 55 Class 199 Siboney CVE 112 CVE 105 Class 203 Sicily CVE 118 CVE 105 Class 203 Sitkoh Bay CVE 86 CVE 55 Class 199 Solomons CVE 67 CVE 55 Class 199 Steamer Bay CVE 87 CVE 55 Class 199 Suwanee CVE 27 CVE 26 Class 191 Takanis Bay CVE 89 CVE 55 Class 199 Thetis Bay CVE 90 CVE 55 Class 199 Tripoli CVE 64 CVE 55 Class 199 Tulagi CVE 72 CVE 55 Class 199 Vella Gulf CVE 111 CVE 105 Class 203 Wake Island CVE 65 CVE 55 Class 199 White Plains CVE 66 CVE 55 Class 199 Windham Bay CVE 92 CVE 55 Class 199
[B L A N K]
CVE 1 CLASS
Fuel in Thousands of GallonsSHIPS IN CLASS:
CVE 1A statistical study of the war service fuel consumption of CVE 1 will be issued when sufficient data are available.
[B L A N K]
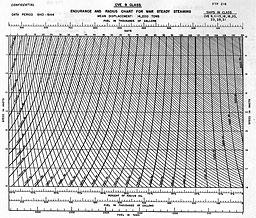
DATA PERIOD 1943-1944 CVE 9 CLASS
ENDURANCE AND RADIUS CHART FOR WAR STEADY STEAMING
MEAN DISPLACEMENT: 14,200 TONS
Fuel in Thousands of GallonsSHIPS IN CLASS:
CVE CVE 9, 11-13, 16, 18, 20, 23, 25, 31
BCVE 6-8, 10, 14, 15, 17, 19, 22, 24, 32-54
* Same as maximum capacity (95%) for this class of vessels; see table V.
DATA PERIOD 1943-1944 CVE 9 CLASS
Table I.--WAR LOGISTICS DATA FOR STEADY STEAMING
BASED ON RADIUS OIL*SHIPS IN CLASS:
CVE 9, 11-13, 16, 18, 20, 23, 25, 31
BCVE 6-8, 10, 14, 15, 17, 19, 22, 24, 32-54
PROP. SPEED FUEL RATE ENDURANCE SPEED RADIUS SPEED RADIUS FUEL RATE WORK COLUMN MEAN NORMAL RANGE DAILY Mean displacement 14,200 tons† Mean displacement 12,200 tons Mean displacement 14,200 tons† (1) (2) (3) (4) (5) (6) (7) (8) (9) (10) (11) R.P.M. Gal./hr. Gal./hr. Bbl./day Hours Days Knots Engine miles Knots Engine miles Gal./eng. mi. 45 289 261-319 165±6 3,295±14 137.3 10.0±0.1 33,760±530 9.9±0.1 32,620±520 29.2 50 329 297-363 188±7 2,894±14 120.6 11.0±.1 32,720±530 10.9±.1 31,540±520 30.2 55 374 338-412 214±8 2,546±13 106.1 12.1±.1 31,650±530 12.0±.1 30,550±520 31.2 60 425 384-469 243±9 2,240±12 93.3 13.2±.1 30,360±530 13.1±.1 29,340±520 32.4 65 483 436-533 276±10 1,971±11 82.1 14.2±.1 28,770±530 14.1±.1 27,790±520 34.3 70 549 496-605 314±12 1,734±11 72.2 15.2±.2 27,060±530 15.1±.2 26,180±520 36.4 75 624 564-688 357±13 1,526±10 63.6 16.1±.2 25,210±480 16.0±.2 24,420±470 39.0 80 709 641-782 405±15 1,343±9 56.0 17.1±.2 23,560±440 16.9±.2 22,700±430 42.0 85 806 728-889 461±17 1,181±9 49.2 18.0±.2 21,800±410 17.7±.2 20,900±400 45.5 86 827 747-912 473±18 1,151±9 48.0 18.1±.2 21,380±410 9±.2 20,600±400 46.2
† Mean displacement during data period.
‡ Estimated speed at designed shaft horsepower (9,350 s.h.p.).
DATA PERIOD 1943-1944
CVE 9 CLASSSHIPS IN CLASS:
CVE 9, 11-13, 16, 18, 20, 23, 25, 31
BCVE 6-8, 10, 14, 15, 17, 19, 22, 24, 32-54
Table II.--WAR LOGISTICS DATA: UNDERWAY AVERAGES
* Based on radius oil; see table V.
Average speed Fuel rate Endurance* R.P.M. Knots Bbl./day Days 72.4 15.5 352±58 64.4±1.8
Table III.--WAR LOGISTICS DATA: NOT UNDERWAY
* Based on radius oil; see table V.
Fuel rate Endurance* Gal./hr. Bbl./day Days 96 55 413.2
Table IV.--PROPELLER SPECIFICATIONS
[Note: All underway data are based on the propellers specified below.
In the case of ships whose propellers not conform to these specifications,
see discussion of table IV in Introduction.]
Number of propellers Number of blades Diameter Pitch 1 4 21.667' 21.669' at 0.7R
Table V.--FUEL CAPACITIES
Capacity Gallons Barrels Tons "Full load" fuel oil capacity§ 911,330 21,698 3,290 Diesel oil capacity (95%) 40,820 972 130 Total: radius oil*. 952,150 22,670 3,420 Additional fuel oil required to fill all tanks to 95% (emergency) 0 0 0 Total: maximum capacity (95%)* 952,150 22,670 3,420
§ Based on considerations of cruising radius and power of survival as affected by reserve buoyancy.
* For this class of vessels radius oil and maximum capacity (95%) are identical.Conversion factors:
Diesel oil: 314 gallons = 1 ton. Fuel oil: 277 gallons = 1 ton. Diesel oil and fuel oil: 42 gallons = 1 barrel.
Table IAA.--WAR LOGISTICS DATA FOR STEADY STEAMING
BASED ON MAXIMUM CAPACITY {95%)*Data for Integral Ship Speeds
* See table V.
Speed Radius Endurance Fuel rate Mean displacement 14,200 tons Knots Engine miles Days Bbl./day 10 32,510 135.6 167 11 31,450 119.3 190 12 30,550 106.1 214 13 29,450 94.5 240 14 27,940 83.2 273 15 26,340 73.2 310 16 24,420 63.6 357 17 22,480 55.2 412
Table VI.--STEADY STEAMING MEAN FUEL RATE RATIOS*
* Table VI is used to adjust the class data in tables I and IAA to individual ships.
Ship Average displacement Fuel rate ratio--Ship: Class 55 R.P.M. 65 R.P.M. 75 R.P.M. 85 R.P.M. Tons Percent Percent Percent Percent U.S.S. Bogue CVE 9 14,400 109.7 107.2 104.7 102.3 U.S.S. Card CVE 11 13,800 104.6 103.6 102.7 101.7 U.S.S. Nassau CVE 16 13,800 94.9 95.8 96.7 97.6 U.S.S. Altamaha CVE 18 13,900 91.3 92.8 94.3 95.9 U.S.S. Breton CVE 23 14,700 94.7 95.7 96.7 97.8 U.S.S. Croatan CVE 25 14,600 104.7 104.8 104.8 104.8
The ratios were obtained by dividing the steady steaming mean fuel rates of the indicated ships
by the corresponding mean fuel rates given in column (2) of table I.
[B L A N K]
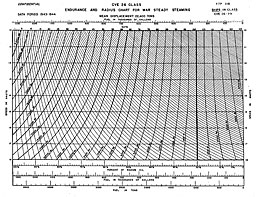
DATA PERIOD 19434-1944 CVE 26 CLASS
ENDURANCE AND RADIUS CHART FOR WAR STEADY STEAMING
MEAN DISPLACEMENT: 22,400 TONS
Fuel in Thousands of GallonsSHIPS IN CLASS:
CVE 26-29
* See table V.
DATA PERIOD 1943-1944 CVE 26 CLASS
Table I.--WAR LOGISTICS DATA FOR STEADY STEAMING
BASED ON RADIUS OIL*SHIPS IN CLASS:
CVE 26-29
PROP. SPEED FUEL RATE ENDURANCE SPEED RADIUS SPEED RADIUS FUEL RATE WORK COLUMN MEAN NORMAL RANGE DAILY Mean displacement 22,400 tons† Mean displacement 19,400 tons Mean displacement 22,400 tons† (1) (2) (3) (4) (5) (6) (7) (8) (9) (10) (11) R.P.M. Gal./hr. Gal./hr. Bbl./day Hours Days Knots Engine miles Knots Engine miles Gal./eng. mi. 50 438 389-491 250±11 3,038±16 126.6 10.1±0.1 31,470±530 10.0±0.1 30,380±510 43.8 55 497 441-557 284±12 2,678±15 111.6 11.1±.1 30,510±530 11.0±.1 29,460±510 45.2 60 563 500-631 322±14 2,364±14 98.5 12.1±.1 30,040±530 12.0±.1 28,370±510 46.9 65 639 567-716 365±16 2,083±13 86.8 13.0±.1 28,460±530 12.9±.1 26,870±510 49.5 70 725 643-813 414±18 1,835±13 76.5 14.0±.1 27,010±530 13.9±.1 25,510±510 52.2 75 823 730-923 470±20 1,617±12 67.4 15.0±.2 25,500±530 14.9±.2 24,090±510 55.2 80 934 829-1,047 534±23 1,425±11 59.4 15.9±.2 23,830±530 15.8±.2 22,520±510 59.1 85 1,061 942-1,189 606±26 1,254±11 52.2 16.8±.2 22,180±530 16.6±.2 20,820±510 63.9 90 1,204 1,069-1,350 688±30 1,105±10 46.0 17.6±.3 20,450±530 17.4±.3 19,230±510 69.2 93 1,300 1,154-1,457 743±32 1,024±10 42.7 18.1±.3 19,510±510 ‡17.9±.3 18,330±490 72.6
† Mean displacement during data period..
‡ Estimated speed at designed shaft horsepower (13,500 s.h.p.).
DATA PERIOD 1943-1944
CVE 26 CLASSSHIPS IN CLASS:
CVE 26-29
Table II.--WAR LOGISTICS DATA: UNDERWAY AVERAGES
* Based on radius oil; see table V.
Average speed Fuel rate Endurance* R.P.M. Knots Bbl./day Days 78.5 15.5 542±90 58.5±1.7
Table III.--WAR LOGISTICS DATA: NOT UNDERWAY
* Based on radius oil; see table V.
Fuel rate Endurance* Gal./hr. Bbl./day Days 163 93 340.2
Table IV.--PROPELLER SPECIFICATIONS
[Note: All underway data are based on the propellers specified below.
In the case of ships whose propellers do not conform to these specifications,
see discussion of table IV in Introduction.]
Number of propellers Number of blades Diameter Pitch 2 4 17'6" 22.19'
Table V.--FUEL CAPACITIES
Capacity Gallons Barrels Tons "Full load" fuel oil capacity§ 1,274,200 30,338 4,600 Diesel oil capacity (95%) 56,520 1,346 180 Total: radius oil* 1,330,720 31,684 4,780 Total: maximum capacity (95 %)† 13,500
§ Based on considerations of cruising radius and power of survival as affected by reserve buoyancy.
* A11 values of endurance and radius are based on radius oil.
† For this class of vessels the value given for maximum capacity (95%) is the approximate weight of oil that can be carried without exceeding the tropical load line draft. This weight involves carrying fuel oil in wing cargo tanks,which should be accepted only in emergencies because of the probability of serious fire in case of underwater attack. It also involves overloading with sacrifice of reserve buoyancy and hence power of survival.Conversion factors:
Diesel oil: 314 gallons = 1 ton. Fuel oil: 277 gallons = 1 ton. Diesel oil and fuel oil: 42 gallons = 1 barrel.
Table IAA.--WAR LOGISTICS DATA FOR STEADY STEAMING
BASED ON RADIUS OIL*
Data for Integral Ship Speeds
* See table V.
Speed Radius Endurance Fuel rate Mean displacement 22,400 tons Knots Engine miles Days Bbl./day 10 30,380 126.6 250 11 29,460 111.6 284 12 28,370 98.5 322 13 26,730 85.8 370 14 25,370 75.6 420 15 23,920 66.5 477 16 22,100 57.6 552 17 20,020 49.1 647
Table VI.--STEADY STEAMING MEAN FUEL RATE RATIOS*
* Table VI is used to adjust the class data in tables I and IAA to individual ships.
Ship Average displacement Fuel rate ratio--Ship: Class 50 R.P.M. 60 R.P.M. 70 R.P.M. 80 R.P.M. 90 R.P.M. Tons Percent Percent Percent Percent Percent U.S.S. Sangamon CVE 26 22,900 102.9 101.5 100.0 98.4 96.9 U.S.S. Suwanee CVE 27 21,600 102.4 101.7 100.9 100.2 99.3 U.S.S. Chenango CVE 28 22,400 88.1 91.9 95.8 99.9 104.0 U.S.S. Santee CVE 29 22,500 106.6 104 9 103.2 101.5 99.8
The ratios were obtained by dividing the steady steaming mean fuel rates of the indicated ships
by the corresponding mean fuel rates given in column (2) of table I.
[B L A N K]
CVE 30 CLASS SHIPS IN CLASS:
CVE 30A statistical study of the war service fuel consumption of CVE 30 will be issued when sufficient data are available.
[B L A N K]
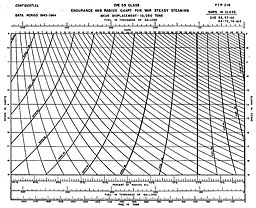
DATA PERIOD 1943-1944 CVE 55 CLASS
ENDURANCE AND RADIUS CHART FOR WAR STEADY STEAMING
MEAN DISPLACEMENT: 10,050 TONS
Fuel in Thousands of GallonsSHIPS IN CLASS:
CVE 55, 57-62, 64-72, 74-104
* See table V.
DATA PERIOD 1943-1944 CVE 55 CLASS
Table I.--WAR LOGISTICS DATA FOR STEADY STEAMING
BASED ON RADIUS OIL*SHIPS IN CLASS:
CVE 55, 57-62, 64-72, 74-104
PROP. SPEED FUEL RATE ENDURANCE SPEED RADIUS SPEED RADIUS FUEL RATE WORK COLUMN MEAN NORMAL RANGE DAILY Mean displacement 10,050 tons† Mean displacement 8,050 tons Mean displacement 10,050 tons† (1) (2) (3) (4) (5) (6) (7) (8) (9) (10) (11) R.P.M. Gal./hr. Gal./hr. Bbl./day Hours Days Knots Engine miles Knots Engine miles Gal./eng. mi. 80 442 380-510 253±14 1,190±13 49.6 9.5±0.1 11,650±260 9.4±0.1 11,190±250 47.0 85 477 410-551 273±15 1,103±12 46.0 10.1±.1 11,660±260 10.0±.1 11,030±240 47.7 90 514 442-593 294±16 1,024±12 42.7 10.7±.1 11,440±260 10.6±.1 10,850±240 48.5 11.0 10,700 49.2 95 555 477-641 317±17 948±12 39.5 11.3±.1 11,220±260 11.2±.1 10,620±240 49.6 100 598 514-690 342±19 880±11 36.7 11.9±.1 10,950±260 11.8±.1 10,380±230 50.7 12.0 10,240 51.4 105 645 554-745 369±20 816±11 34.0 12.5±.1 10,840±260 12.3±.1 10,040±230 52.4 110 695 597-802 397±22 757±10 31.5 13.1±.1 10,520±260 12.9±.1 9,770±230 53.9 13.0 9,720 54.2 115 750 644-866 429±24 701±10 29.2 13.7±.1 10,370±260 13.5±.1 9,460±230 55.6 120 808 694-933 462±25 651±10 27.1 14.3±.1 10,020±260 14.0±.1 9,110±230 57.7 125 871 748-1,005 498±27 604±9 25.2 14.8±.1 9,630±260 14.6±.1 8,820±230 59.7 15.0 8,530 61.8 130 940 808-1,085 537±30 560±9 23.3 15.4±.1 9,300±260 15.1±.1 8,460±230 62.3 135 1,013 870-1,169 579±32 519±9 21.6 16.0±.1 8,960±260 15.7±.1 8,150±230 64.5 16.0 7,950 66.2 140 1,092 938-1,261 624±34 482±8 20.1 16.5±.2 8,560±260 16.2±.2 7,810±230 67.4 145 1,178 1,012-1,360 673±37 447±8 18.6 17.1±.2 8,240±250 16.8±.2 7,510±230 70.1 17.0 7,370 71.4 150 1,270 1,091-1,466 726±40 414±8 17.2 17.6±.2 7,870±250 17.3±.2 7,160±230 73.4 155 1,369 1,176-1,580 782±43 384±8 16.0 18.2±.2 7,530±250 17.8±.2 6,840±230 76.9 18.0 6,710 78.4 160 1,477 1,269-1,705 844±46 356±7 14.8 18.7±.2 7,180±250 18.3±.2 6,510±210 80.7 165 1,592 1,368-1,838 910±50 330±7 13.8 19.2±.3 6,740±250 18.8±.2 6,200±200 84.7 19.0 6,030 87.2 169 1,691 1,453-1,952 966±53 311±7 13.0 19.6±.3 6,390±240 ‡l9.1±.2 5,940±200 88.5
† Mean displacement during data period.
‡ Estimated speed at designed shaft horsepower (11,400 s.h.p.).
DATA PERIOD 1943-1944
CVE 55 CLASSSHIPS IN CLASS:
CVE 56, 57-62, 64-72, 74-104
Table II.--WAR LOGISTICS DATA: UNDERWAY AVERAGES
* Based on radius oil; see table V.
Average speed Fuel rate Endurance* R.P.M. Knots Bbl./day 132.0 15.3 592±116 21.2±1.3
Table III.--WAR LOGISTICS DATA: NOT UNDERWAY
* Based on radius oil; see table V.
Fuel rate Endurance* Gal./hr. Bbl./day Days 165 94 132.9
Table IV.--PROPELLER SPECIFICATIONS
[Note: All underway data are based on the propellers specified below.
In the case of ships whose propellers do not conform to these specifications,
see discussion of table IV in Introduction.]
Number of propellers Number of blades Diameter Pitch 2 4 12'3" 13'81/2"
Table V.--FUEL CAPACITIES
Capacity Gallons Barrels Tons "Full load" fuel oil 522,976 12,452 1,888 Diesel oil capacity (95%) 3,140 75 10 Total: radius oil*. 526,116 12,527 1,898 Additional fuel oil required to fill all tanks to 95% (emergency) 105,537 2,513 381 Total: maximum capacity (95%)† 631,653 15,040 2,279
§ Based on considerations of cruising radius and power of survival as affected by reserve buoyancy.
* In tables I,II,and III endurance and radius are based on radius oil.
† In table IA endurance and radius are based on maximum capacity (95%).Conversion factors:
Diesel oil: 314 gallons = 1 ton. Fuel oil: 277 gallons = 1 ton. Diesel oil and fuel oil: 42 gallons = 1 barrel.
Table IA.--WAR LOGISTICS DATA FOB STEADY STEAMING
BASED ON MAXIMUM CAPACITY (95%)*[Note: Fueling beyond the radius oil capacity increases radius at the expense of resistance
to underwater damage. This table is made available to the commander as a supplement to table I
for use when increased radius and decreased resistance to underwater damage are factors in a decision.]
* See table V.
Speed Radius Endurance Fuel rate Mean displacement 10.0SO tons Knots Engine miles Days Bbl./day 10 13,240 55.2 273 11 12,850 48.7 309 12 12,290 42.7 353 13 11,670 37.3 402 14 10,940 32.5 462 15 10,240 28.5 529 16 9,540 24.9 606 17 8,850 21.6 694 18 8,060 18.6 807 19 7,240 16.0 947
Table VI.--STEADY STEAMING MEAN FUEL RATE RATIOS*
* Table VI is used to adjust the class data in tables I and IA to individual ships.
Ship Average displacement Fuel rate ratio--Ship: Class 80 R.P.M. 100 R.P.M. 120 R.P.M. 140 R.P.M. 100 R.P.M. Tons Percent Percent Percent Percent Percent U.S.S. Mission Bay CVE 59 9,700 97.2 97.2 97.2 97.2 97.1 U.S.S. Guadalcanal CVE 60 9,800 94.6 95.5 96.3 97.2 98.1 U.S.S. Manila Bay CVE 61 10,200 98.6 98.9 99.3 99.6 100.0 U.S.S. Natoma Bay CVE 62 10,550 109.7 108.4 107.2 106.0 104.8
The ratios were obtained by dividing the steady steaming mean fuel rates of the indicated ships
by the corresponding mean fuel rates given in column (2) of table I.
[B L A N K]
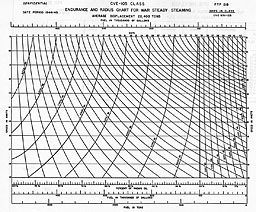
DATA PERIOD 1944-1945 CVE 105 CLASS
ENDURANCE AND RADIUS CHART FOR WAR STEADY STEAMING
MEAN DISPLACEMENT: 22,400 TONS
Fuel in Thousands of GallonsSHIPS IN CLASS:
CVE 105-123
* See table V
DATA PERIOD 1944-1945 CVE 105 CLASS
Table I.--WAR LOGISTICS DATA FOR STEADY STEAMING
BASED ON RADIUS OIL*SHIPS IN CLASS:
CVE 105-123
PROPELLER SPEED FUEL RATE ENDURANCE SPEED RADIUS SPEED RADIUS FUEL RATE WORK COLUMN MEAN NORMAL RANGE DAILY Mean displacement 22,400 tons† Mean displacement 19,400 tons Mean displacement 22,400 tons† (1) (2) (3) (4) (5) (6) (7) (8) (9) (10) (11) R.P.M. Gal./hr. Gal./hr. Bbl./day Hours Days Knots Engine miles Knots Engine miles Gal./eng. mi. 50 493 441-549 282±11 1,004±9 41.8 10.0±0.1 10,230±260 9.6±0.1 9,640±250 51.4 55 546 488-608 312±13 907±9 37.8 11.0±.1 10,190±260 10.6±.1 9,610±250 51.5 60 604 540-672 345±14 820±8 34.2 12.0±.1 10,250±260 11.6±.1 9,510±250 52.1 65 668 598-743 382±16 741±8 30.9 12.9±.2 9,970±260 12.5±.2 9,260±250 53.4 70 738 660-821 422±17 671±7 28.0 13.8±.2 9,630±260 13.4±.2 8,990±240 55.1 75 817 731-909 467±19 606±7 25.2 14.8±.2 9,350±250 14.3±.2 8,670±240 57.1 80 903 808-1,005 516±21 548±7 22.8 15.6±.2 8,910±250 15.1±.2 8,270±240 59.8 85 999 894-1,112 571±23 496±6 20.7 16.5±.2 8,510±250 16.0±.2 7,940±240 62.4 90 1,106 989-1,231 632±26 448±6 18.7 17.4±.3 8,110±250 16.9±.3 7,570±240 65.4 95 1,223 1,094-1,361 699±28 405±6 16.9 18.1±.3 7,620±240 17.6±.3 7,130±230 69.5 100 1,353 1,210-1,506 773±31 366±6 15.2 18.9±.3 7,200±230 18.4±.3 6,730±230 73.5 102 1,409 1,260-1,568 805±33 351±5 14 6 19.2±.3 7,030±230 ‡18.7±.3 6,560±210 75.3
† Mean displacement during data period.
‡ Estimated speed at designed shaft horsepower (16,000 s.h.p.).
DATA PERIOD 1944-1945
CVE 105 CLASSSHIPS IN CLASS:
CVE 105-123
Table II.--WAR LOGISTICS DATA: UNDERWAY AVERAGES
* Based on radius oil; see table V.
Average speed Fuel rate Endurance* R.P.M. Knots Bbl./day Days 68.0 13.0 455±93 25.9±1.4
Table III.--WAR LOGISTICS DATA: NOT UNDERWAY
*Based on radius oil; see table V.
Fuel rate Endurance* Gal./hr. Bbl./day Days 171 98 120.7
Table IV.--PROPELLER SPECIFICATIONS
Note.--All underway data are based on the propellers specified below.
In the case of ships whose propellers do not conform to these specifications,
see discussion of table IV in Introduction.In case of a propeller change see discussion of table IV in Introduction.
Number of propellers Number of blades Diameter Pitch 2 4 17'6" 20'10"
Table V.--FUEL CAPACITIES
Capacity Gallons Barrels Tons "Full load" fuel oil capacity§ 481,703 11,469 1,739 Diesel oil capacity (95%) 13,502 321 43 Total: radius oil* 495,205 11,790 1,782 Additional fuel oil required to fill all tanks to 95% (emergency). 0 0 0 Total: maximum capacity (95%)* 495,205 11,790 1,782
§ Based on considerations of cruising radius and power of survival as affected by reserve buoyancy.
* For this class of vessels radius oil and maximum capacity (95%) are identical.Conversion factors:
Diesel oil: 314 gallons = 1 ton. Fuel oil: 277 gallons = 1 ton. Diesel oil and fuel oil: 42 gallons = 1 barrel.
Table IAA.--WAR LOGISTICS DATA FOR STEADY STEAMING BASED ON MAXIMUM CAPACITY (95%)*
Note.--Fueling beyond the radius oil capacity increases radius at the expense of resistance
to underwater damage. This table is made available to the commander as a supplement to table I
for use when increased radius and decreased resistance to underwater damage are factors in a decision.
* See table V.
Speed Radius Endurance Fuel rate Mean displacement 22,400 tons Knots Engine miles Days Bbl./day 10 9,630 40.2 294 11 9,570 36.4 325 12 9,400 32.7 361 13 9,110 29.3 404 14 8,780 26.1 452 15 8,320 23.1 510 16 7,940 20.7 571 17 7,510 18.4 642 18 6,930 16.0 736
Table VI.--STEADY STEAMING MEAN FUEL RATE RATIOS*
* Table VI is used to adjust the class data in tables I and IAA to individual ships.
Ship Average displacement Fuel rate ratio--ship: Class 60 R.P.M. 70 R.P.M. 80 R.P.M. 90 R.P.M 100 R.P.M. Tons Percent Percent Percent Percent Percent U.S.S. Commencement Bay CVE 105 22,000 96.9 96.3 95.7 95.1 94 5 U.S.S. Gilbert Islands CVE 107 22,300 101.6 101.6 101.7 101.8 101.8 U.S.S. Cape Gloucester CVE 109 22,800 106.4 104.4 102.5 100.6 98.7 U.S.S. Salerno Bay CVE 110 21,900 93.0 94 2 95.4 96.6 97.7 U.S.S. Vella Gulf CVE 111 23,200 102.2 103.4 104 7 105.9 107.2
The ratios were obtained by dividing the steady steaming mean fuel rates of the indicated ships
by the corresponding mean fuel rates given in column (2) of table I.
[B L A N K]
Table of Contents
Previous Chapter (Aircraft Carriers, Small) * Next Chapter (Destroyers)